Samantha Smith: Reader/ Contributor, Watson Harlan: Contributor
“L’amour est à réinventer. (Love must be reinvented)”
Délire I: Foolish Virgin, The Infernal Bridegroom”, Arthur Rimbaud, Photographs used for educational and non-commercial purposes only.
When Rimbaud stated, “Love must be reinvented”, he was speaking of how standard models of relationships and behaviors did not fit with his needs and desires. As a man who was same-sex attracted his poetry struggles with imposed expectations and how those expectations bring him to levels of despair and self-hatred. I don’t think he was only speaking about the intimate system of love between individuals, I take his statement to call out his frustration with all systems of structure that didn’t operate in a way that benefitted those encased within its walls. It is from this perspective that I make a uniquely queer connection and speak about this need for reinvention in reference to non-profit leadership and management structures. For me, it’s not such an unreasonable leap. I have long realized that one of the ways to understand and operate within the established non-profit field is deeply influenced by numerous dominant & marginalized experiences.
This is my first step in visualizing a new organizational form to non-profit structures and leadership, that is to embrace the fuzzy margins and edges of these operations rather than more illuminated and formalized center. In order to imagine an existence, we must visualize new forms within which we can experiment with, as Dr. Porchia Moore stated in her recent article CARTOGRAPHY: A BLACK WOMAN’S RESPONSE TO MUSEUMS IN THE TIME OF RACIAL UPRISING, https://incluseum.com/2020/06/10/cartography-a-black-womans-response-to-museums-in-the-time-of-racial-uprising/, new cartographies. When Dr. Moore speaks of cartographies, she is discussing a full spectrum of intangible policy, leadership, and Board of Trustees relationships, but I believe in order to more easily build an anti-racist organization we need a new fundamental way to visualize the change we seek. Self- perception is so important in producing real change. It also seems important that how we visually document and present that idealized change needs to grow out of the behavioral structure of the information we seek to convey – and not be applied to a pre-existing visual model. In many ways, the visual model shouldn’t look like anything that came before as the change we are seeking is organizationally transformative in a way that the very form of, as Dr, Moore argues, our new “cartographic directions” should appear as physically indicative as the change we seek.
Recently I participated in an online Preservation Conference (Dismantle Preservation) organized by Sara Marsom. The panel that I was a participant in, Identifying and Tackling Implicit Bias In Preservation, was organized by Jeffry Harris and contained Melissa Jest, Sam Collins, and myself. I also was an attendee to the entirety of this conference and also was an attendee in another online conference, Death To Museums. Death To Museums was created by June Ahn, Rose Cannon, and Emma Turner-Trujillo. Engaging in both of these conferences, and learning from others such as LaTanya S. Autry, Mike Murawski, Michelle Moon, Margaret Middleton, Joe McGill, Joan Baldwin, Nina Simon, Elon Cook, Monica Montgomery Nyathi, and Taylor Stoermer (and the list goes on and on), are pushing me into a deeper understanding of the ways in which our non-profit organizations are not serving those who work at and engage with them. This core idea is not new to me, as a member of the Queer Community my relationship with the established system has been somewhat tentative and I have often found myself silenced in ways that even I couldn’t verbalize or document. Following these conferences, I began re-visiting organizational visual experiments that have followed my non-profit practice.
I wanted to ask: What might a decentralized leadership model be. What about Co-Leadership Model? How would it work if you placed Visitor Service/Educators at the center of the organization rather than all the way at the bottom? What would a Collaborative organizational structure look like? When non-profits are not neutral, then how do we visually represent that component in form? How are our present visualizations suppressing these models of shared leadership and allowing for continued systemic bias in the very operational fabric? How would new funding models assist in these changes? So many questions and the first thing I have always thought was that the way we see ourselves didn’t match up with how we were illustrating ourselves.
This experiment is an attempt to, in a naive way, try to assist in moving forward and amplifying Dr. Moore’s thesis. The basis of this idea rests on the assumption that visualizations matter in documenting and formalizing change.
How We Visualize Ourselves Matters
As a sculptor and architectural designer (my life before going into museum practice), I see how much an idea changes once it is constructed in a 3-dimensional form. Concept to form is a tricky translation. All we have to do is look at how the sphere of the Earth has been visualized by various cultures. It is really clear that the dominant culture latently produces visualizations that place their power and control at the center all others in the margins. As an example, take a look at two maps of the Earth. The map on the left is the one that most of us grew up seeing in school. The map on the right, created in 1999 by Japanese Architect Hajime Narukwaw – https://www.intelligentliving.co/most-accurate-map-of-the-world/ , shows a visualization of the Earth with landmass sizes accurately depicted and de-centralizes dominance and power. Traditional biases are removed by shifting concepts like top/bottom; left/right/; and large/small.
Another mapping comparison can be viewed when looking at political distinctions. In the four other maps, I am comparing a map of native indigenous peoples in both the continent now occupied by Australia and the North American continent. As one can see the map of the traditional Native American populations are far more complex and nuanced than the present political boundaries represent. This has a direct relationship to the type and forms of political organizations, behaviors, and processes of these groups. One is a fluid map of relationships while the other is a highly defined map of control and dominance. Photographs used for educational and non-commercial purposes only.

To better understand how these two maps document drastically different forms of governance, I asked Watson Harlan, Cherokee Nation Member & Advisor, to explain the collaborative quality of Native Cherokee governance in this way. Photographs used for educational and non-commercial purposes only.
“Historian Differing ideals on the hierarchy are common within the North American continent, especially within native cultures. The Cherokee Nation is one such entity that from its early period has been largely democratic and consensus-based, with the only hierarchy present being one of geographic limitation. The colonial Cherokee Nation of the 18th century and earlier had a democratic Council House any people were allowed to attend and participate in. The representatives of each clan were all women, and the two representatives of the town for diplomatic and civil purposes were men, with the eldest woman in town having supreme executive authority over decisions, but having little say in the creation of laws, other than a supreme veto that demands reconsideration. The Nation then is divided and subdivided based on geography and demographic regions. The four regions of the Cherokee Nation were the Lower, Middle, Valley and Overhill towns, with each having a major commercial and political town as a hub called a Mother Town, where each smaller town then answered for matters military or civic. Each town is then divided into clans that act as both demographic units of representation and kinship systems of family, with each clan being of equal importance.
The equity of Cherokee society can be seen in one of its oldest myths, concerning the Anicotani, a group of sorcerer-kings who once held power and hereditary office over the Cherokee. A warrior once returned from his campaign only to find his wife had been abused by a man of the Anicotani. Fearing his power, the warrior spoke to a friend and found that his friend too had known others abused by the Anicotani. Eventually, the men and women of the nation realized that they all had been abused in some way by the clan, and there was a great uprising wherein the warriors and men slew every single Anicotani, and forbade offices of import or power from ever being hereditary again. So ever since democratic representation and representation of women has been paramount within traditional Cherokee politics. This also has resulted in a distinct collectivist attitude towards problems and the sort of situations that arise in daily living, with group harmony and sense of community being large concepts in Cherokee political and social thought.”
“I must create a system or be enslaved by another mans”
William Blake, Jerusalem: The Emanation of the Giant Albion
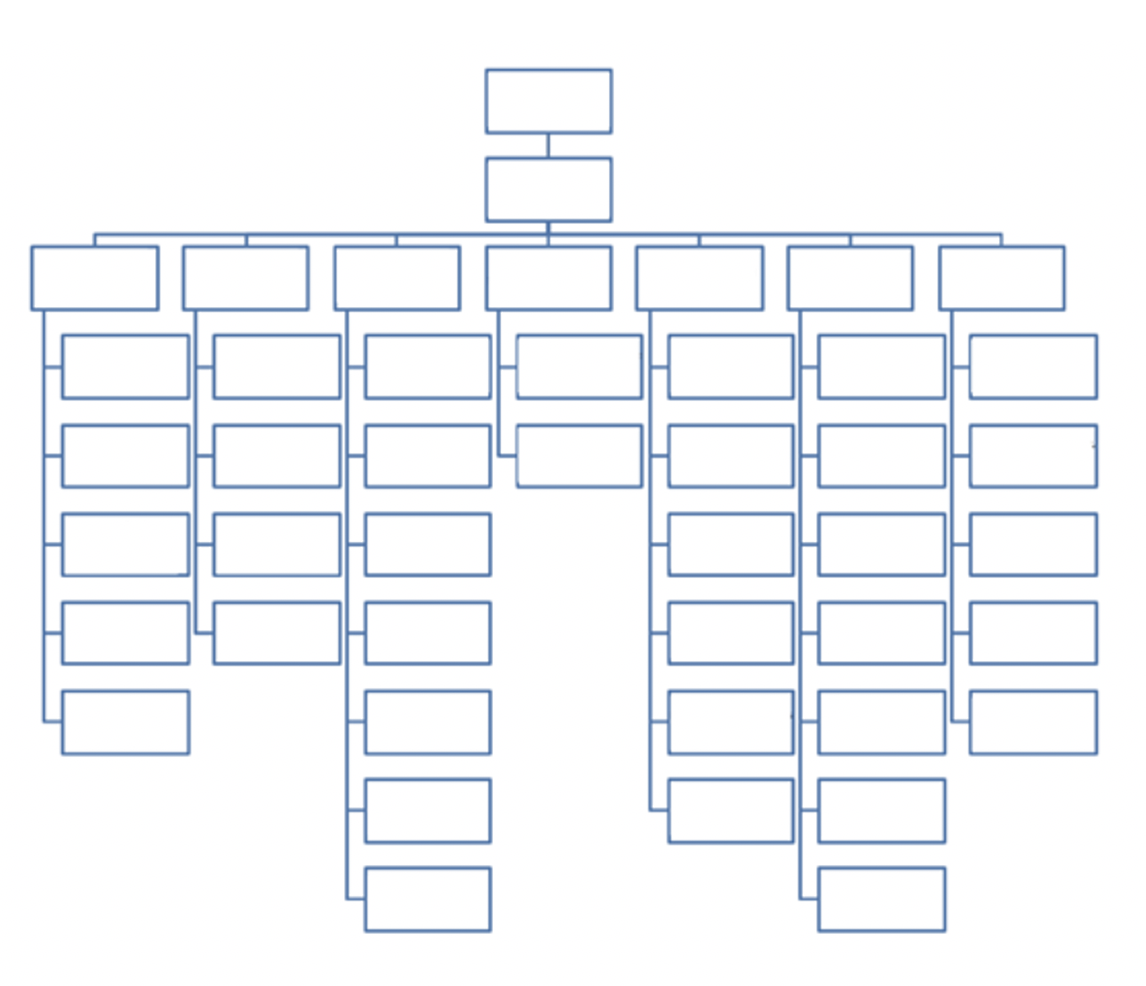
Many of us are quite used to seeing the typical taxonomic, hierarchical organizational chart. Human Resources uses them to equalize salaries, managers use them to better understand oversight reach, Presidents and CEO’s use them to chart strategy, COO’s use them to organize functions and resources, and payroll uses them to keep order to all of the many staffing and labor compliance issues. There must be a better way to visualize an organization.
I don’t speak about this issue without a lot of frustration. One of the first things we do when consulting is to create our own organizational chart. It forces us to better understand the parts and how they connect. Many times, we will create the manifest org. chart and then create one that illuminates the latent relationships and alliances between the parts. We have never had a moment where both of these org charts looked the same – never.
This has led me to appreciate a systems-based understanding of non-profit organizations. This management understanding sees non-profit organizations, not as their formal org chart depicts, but rather as a mesh of interconnected relationships, behaviors, and collaborations. I often would continue to re-imagine organizational structure in new experimental ways.
Where to Start?
This type of re-evaluation is not new to the business and organizational specialists. In August of 1964, Paul Baran, writing about communications networks for the RAND Corporation, outlined three types of communication structures, 1. Centralized, 2. Decentralized, and 3. Distributed. This idea is appealing to me as a basis for re-envisioning a non-profit organization because it starts from the perspective of an intangible (communication) and not physicality. At this point in our experiments the longer we can stay in the conceptual the better.

In Henry Mintzberg’s “The Structuring of Organizations”, 1979, he outlines that one of the most fundamental aspects of organizational structure is how “tall” or “flat” the hierarchy is designed. A tall leadership structure keeps decision making at a distance and relies on top-level leadership executives to create procedures and pass it down the structure as policy. The flatter leadership structure attempts to keep the decision-making more collective, yet still maintains a top-level leadership structure.
In 2007, Brian Robertson, founder of Ternary Software, worked with his company team to present a decentralized management process in which decision-making and operations were distributed throughout the entire company team rather than flow down from an Executive Leadership team. In June 2015 Roberston wrote a book, Holacracy: The New Management System For A Rapidly Changing World.
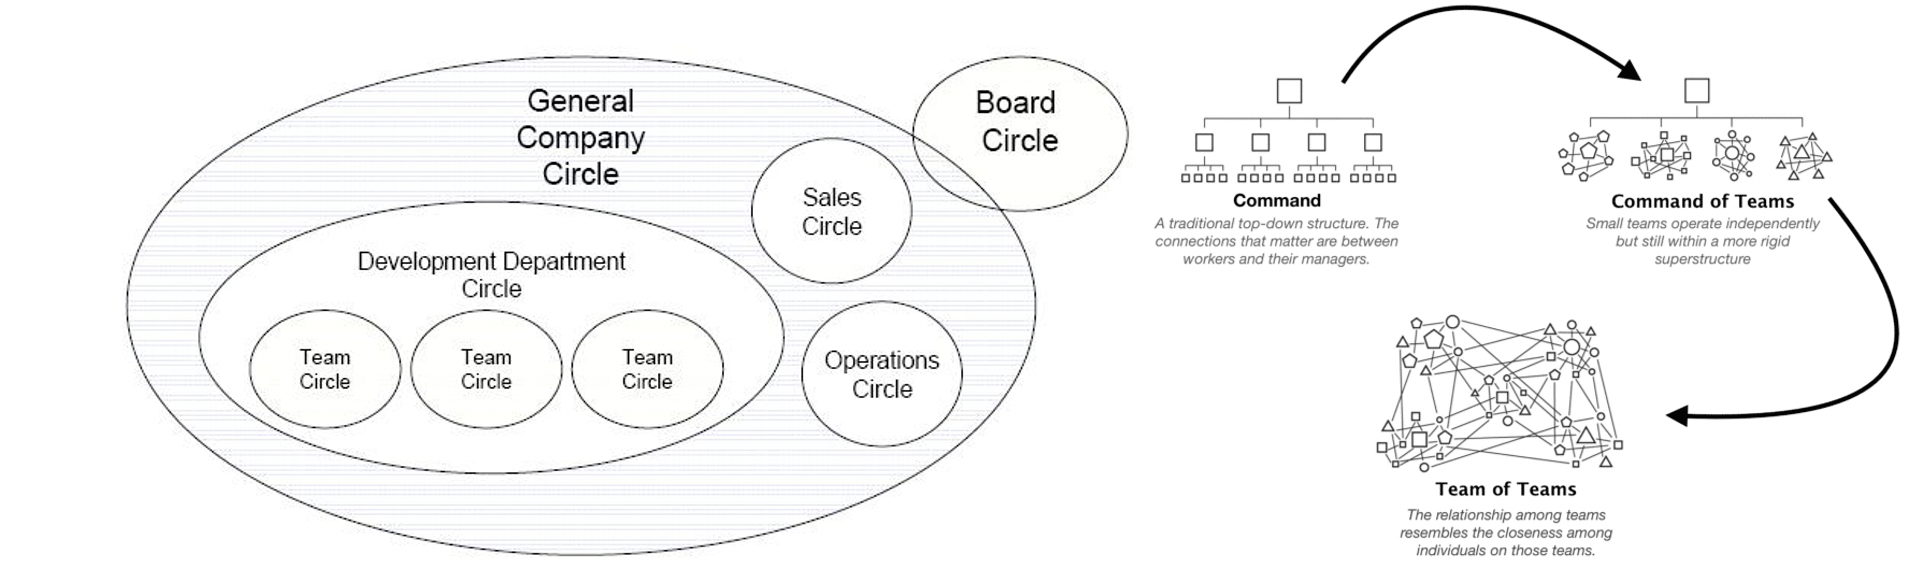
In 2015, 4-star General Stanley McChrystal, in his book Team of Teams: New Rules of Engagement For A Complex World, wrote of the need to re-envision an organizational structure that was nimble, fast-paced, and engaged a grass-roots communication path to allow for a more informed decision-making procedure. He argues for a system of micro-teams acting together to form a macro- team. Photographs used for educational and non-commercial purposes only.
But, What About The Rest Of Us?
One thing to take note of is that all of these organizational models are products from the perspective of the cis-male dominant culture. In 2015, Deborah A. O’Neil and Margaret M. Hopkins presented, “The Impact Of Gendered Organizational Systems On Women’s Career Advancement” and in this article, they outline that existing hierarchical systems promote a male form of aggressive, competitive behavior that, although not as overt a form of bias, produce a potent, latent system of bias against females. I would add the same results appear for BIPOC, and the Queer Community through exclusionary and formal structures. Even in the more “team” oriented governance structures there is inherent competition between the parts and suggests a lack of collaborative mentorship.
To many marginalized populations, these traditional organizational structures are seen as non-supportive of the needs of those employees & talents not having membership in the dominant culture. One of the reasons that we don’t find many women, BIPOC, Queer leaders at the top levels of our organizations is because the systems within which one has to operate are created in ways that promote one type of behavior (Individualistic & Centralized) over another (Collaborative & Decentralized).
Not only do organizational structures suppress mobility, they also act as a filter through which perceptions change. In The Leader-in-Social-Network Schema: Perceptions of Network Structure Affect Gendered Attributions of Charisma (2015), Raina A. Brands, Jochen I. Menges, and Martin Kilduff show that within the hierarchically structured organization the leadership trait of “charisma” is attributed to male leaders, However, when viewed from within a decentralized and collaboratively structured organization, women are perceived as holding greater “charisma” placing the male leaders at a disadvantage.
From a Queer perspective, the highly defined and classified, hierarchical organizational structure is fundamentally at odds with a more fluid and amorphous world view commonly understood by the queer community. Contrary to classical taxonomic cataloging and itemization of parts, most LGBTQ+ understand that absolute labels and categories hold within themselves bias and politics. Highly formalized structures tend to suppress individuality and difference in favor of the collective. In Julie Gedro and Robert C. Mizzi’s article, Feminist Theory and Queer Theory: Implications for HRD Research and Practice (2014), they suggest that normative organizational structures reinforce gender (male) and sexuality (Heterosexuality) privilege and that traditional models of leadership methods privilege some and significantly disenfranchise marginal populations in ways that negatively affect performance and success. This is where the visualization of the organization matters.
Evelyn R. Carter writes in , Restructure Your Organization To Actually Advance Racial Justice (2020), that it is not enough for a traditionally structured organization to simply acknowledge systemic bias and racism, the organizations must deconstruct the very methodologies that are used to train and advance employees. Carter suggests that employees feel a sense of belonging and commitment to the organization the more the leaders of the organization check in with them in an authentic manner. BIPOC feel outside of the traditional hierarchical structure. Traditional organizations lack connective tissue that binds the parts together in ways that value difference. One example of this is the manner in which projects are assigned, managed, and communicated through a system of degrees that separate the creator from the leadership evaluating the project. This separation acts to suppress achievement and mobility within a system that is biased toward those who can satisfy the unconscious biases of the system.
Let’s Try This
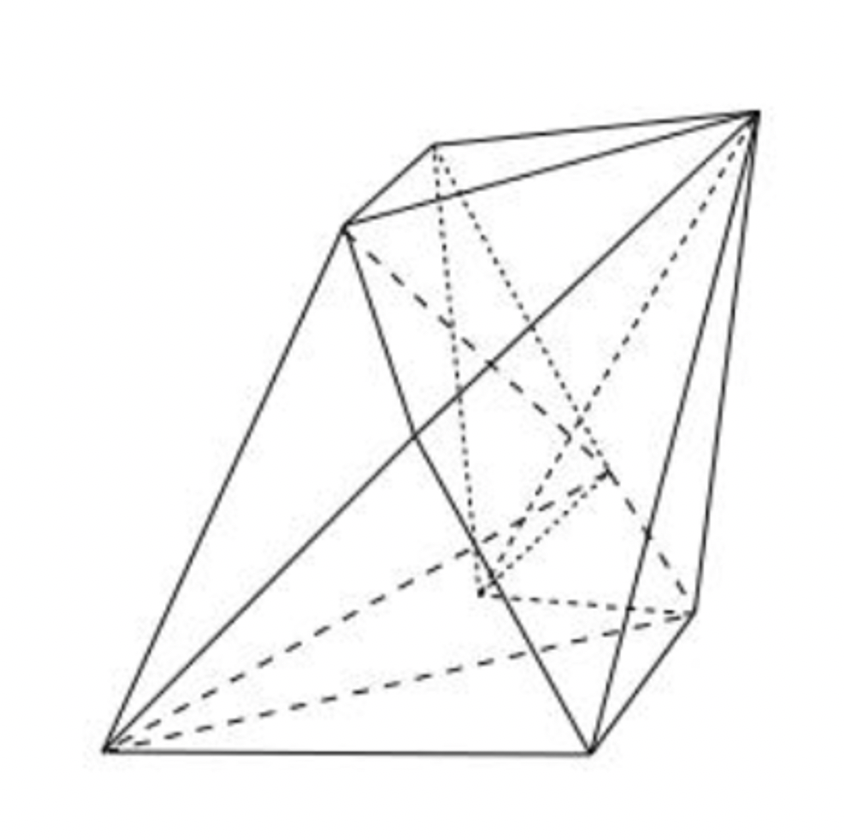
A nonrigid polyhedron may be “shaky” (infinitesimally movable) or flexible (continuously movable).”
Wells, D. The Penguin Dictionary of Curious and Interesting Geometry. London: Penguin, pp. 161-162, 1991. Photographs used for educational and non-commercial purposes only.
Due to my interest in new ways to visualize non-profit organizations, I have experienced several situations where my Supervisor/Board Chair would look at me as if I had just written in another language and told, “I don’t understand you or the way you think”. I learned to keep my visual experiments to myself as I started to realize that there was something about my understanding of the world around me that allowed me to visualize new structures in ways that were clearly off-putting to the dominant culture. What seemed natural to me appeared to be a perversion of standard ways of thinking.

At this point I must beg for tolerance as now is when I ask you to take the great leap into considering two opposing concepts simultaneously. 1. A centralized mission, and 2. A decentralized organizational structure. I have a hard time imagining what such an organization would look like. Being dyslexic I always explore these ideas through tactile kinetic learning experiences. These two concepts began to co-exist in my mind as soon as I read about a Flexible Polyhedron.
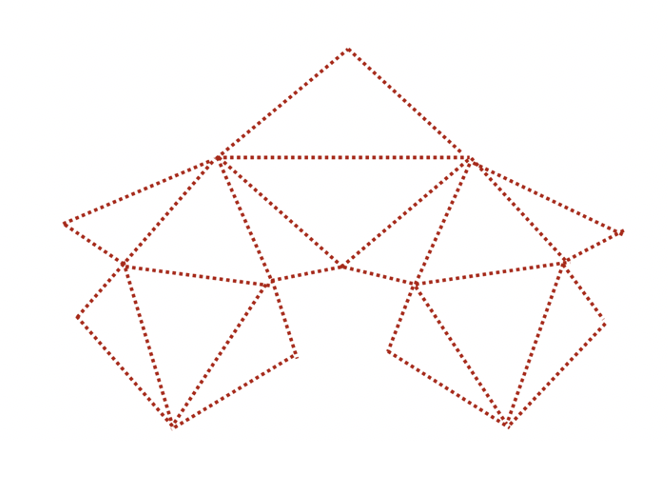
In 1897, Bricard constructed several self-intersecting flexible octahedra (Cromwell 1997, p. 239). Connelly (1978) found the first example of a true flexible polyhedron, consisting of 18 triangular faces (Cromwell 1997, pp. 242-244). Mason discovered a 34-sided flexible polyhedron constructed by erecting a pyramid on each face of a cube adjoined square antiprism (Cromwell 1997). Kuiper and Deligne modified Connelly’s polyhedron to create a flexible polyhedron having 18 faces and 11 vertices (Cromwell 1997, p. 245), and Steffen found a flexible polyhedron with only 14 triangular faces and 9 vertices (shown above; Cromwell 1997, pp. 244-247; Mackenzie 1998). Maksimov (1995) proved that Steffen’s is the simplest possible flexible polyhedron composed of only triangles (Cromwell 1997, p. 245). Connelly et al. (1997) proved that a flexible polyhedron must keep its volume constant, confirming the so-called bellows conjecture (Mackenzie 1998).
Why does this matter in our discussion about experimenting with a new non-profit organizational visualization? If we see a non-profit a community formed of its interactions and behaviors, rather than by its hierarchical power structure, we can begin to imagine a far more complex way of noting in graphic form the structure and relationships between the parts. The Flexible Polyhedron theoretically exists with solid, clearly defined surface shapes, but because of the way it is joined, it is infinitesimally movable and flexible. Guess what? As a scientific theory, this strange 3-dimensional form has as one of its characteristics that it 1. Has a unified collective shape (purpose), while 2. Allowing for continuous changeability between those ridged parts (de-centralized individuality). This odd little polyhedron might be just the thing to help us visualize a new form of non-profit organizational structure.
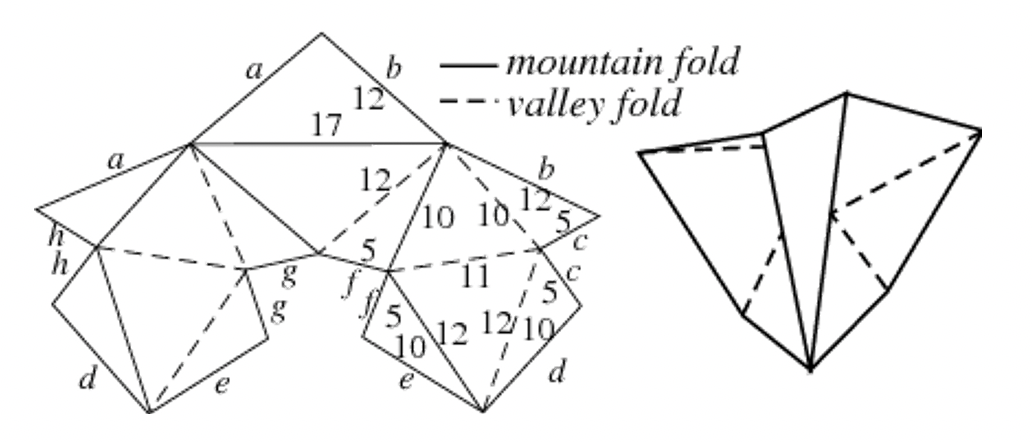
Taking this 3-dimensional idea and flattening it out into a 2-dimensional diagram we can begin to make direct comparisons to the traditional organizational chart. By replacing the rectangular boxes of the traditional organizational chart with triangular surfaces of the polyhedron, and by replacing the singular lines of oversight from the standard organizational diagram with multiple, lose connections between all of the parts, we arrive at a single surface entity whose parts are all collaboratively connected in multiple and flexible ways. In this new experimental visualization, everyone is connected with everyone else in multiple and flexible ways. Since this new 2-dimensional visualization is also a 3-dimensional object, there is no up or down, no primary and secondary, no ultimate path of mobility. All of the parts play a role in the central mission of the organization in unique relationships.

Ok, so now I am sure you think I am nuts. I know that this is just an imaginary form created by mathematicians and has nothing to do with management or organizational structure. But – maybe it can be the unexpected creative catalyst that will allow us to finally break free of our traditional visualizations of non-profit structures and allow us the ability to imagine how our ideal non-profit organization might function. Imagine how concepts like Equity, Diversity, Pay Parity, Mission-centric, Policymaking, and Communications would exist within this new visualized structure of collaborative and flexible relationships. These important issues are no longer the appendage to the larger structure, but now they are the connective tissue between each of the faces of the collective body (the folds of the 3-dimensional model). It becomes almost impossible to separate one item from the other. It forces all of us and keeps us honest in our Equity, Inclusion, Diversity work.
As an example, I have just taken an imaginary non-profit historic site organization and placed its traditional divisions and parts within this 3-dimensional system. Yes, it’s just a shape, but what it does allow is for us to be visually and mentally free from a system that keeps us bound by hierarchy, dominance, structure, and control. How Might this look in actual use? Let’s experiment. Instituting new policies & procedures within an established, highly entrenched system is that the possibility for success is reduced because the system was not designed to accommodate flexibility. The problem with new flexible behaviors is that certain forms of hierarchy and power must recede and become pliable in order for the system to move into a new set of relationships.
Now What?
How can this wonky 2-dimensional form be used to fuel a revolution in non-profit operations? I do believe one of the first steps in transforming our non-profit organizations is to be self-reflective and visualize them, both graphically and in terms of the policy as having different behaviors. In addressing the systems within which we operate, biases and leveraged power dynamics can be reduced. In using a visualization such as the one example cited above, we might be able to re-envision the system to produce the types of interactions, and decision-making that is desired. I am always open to new ideas from my colleagues!
Photographs used for educational and non-commercial purposes only.
